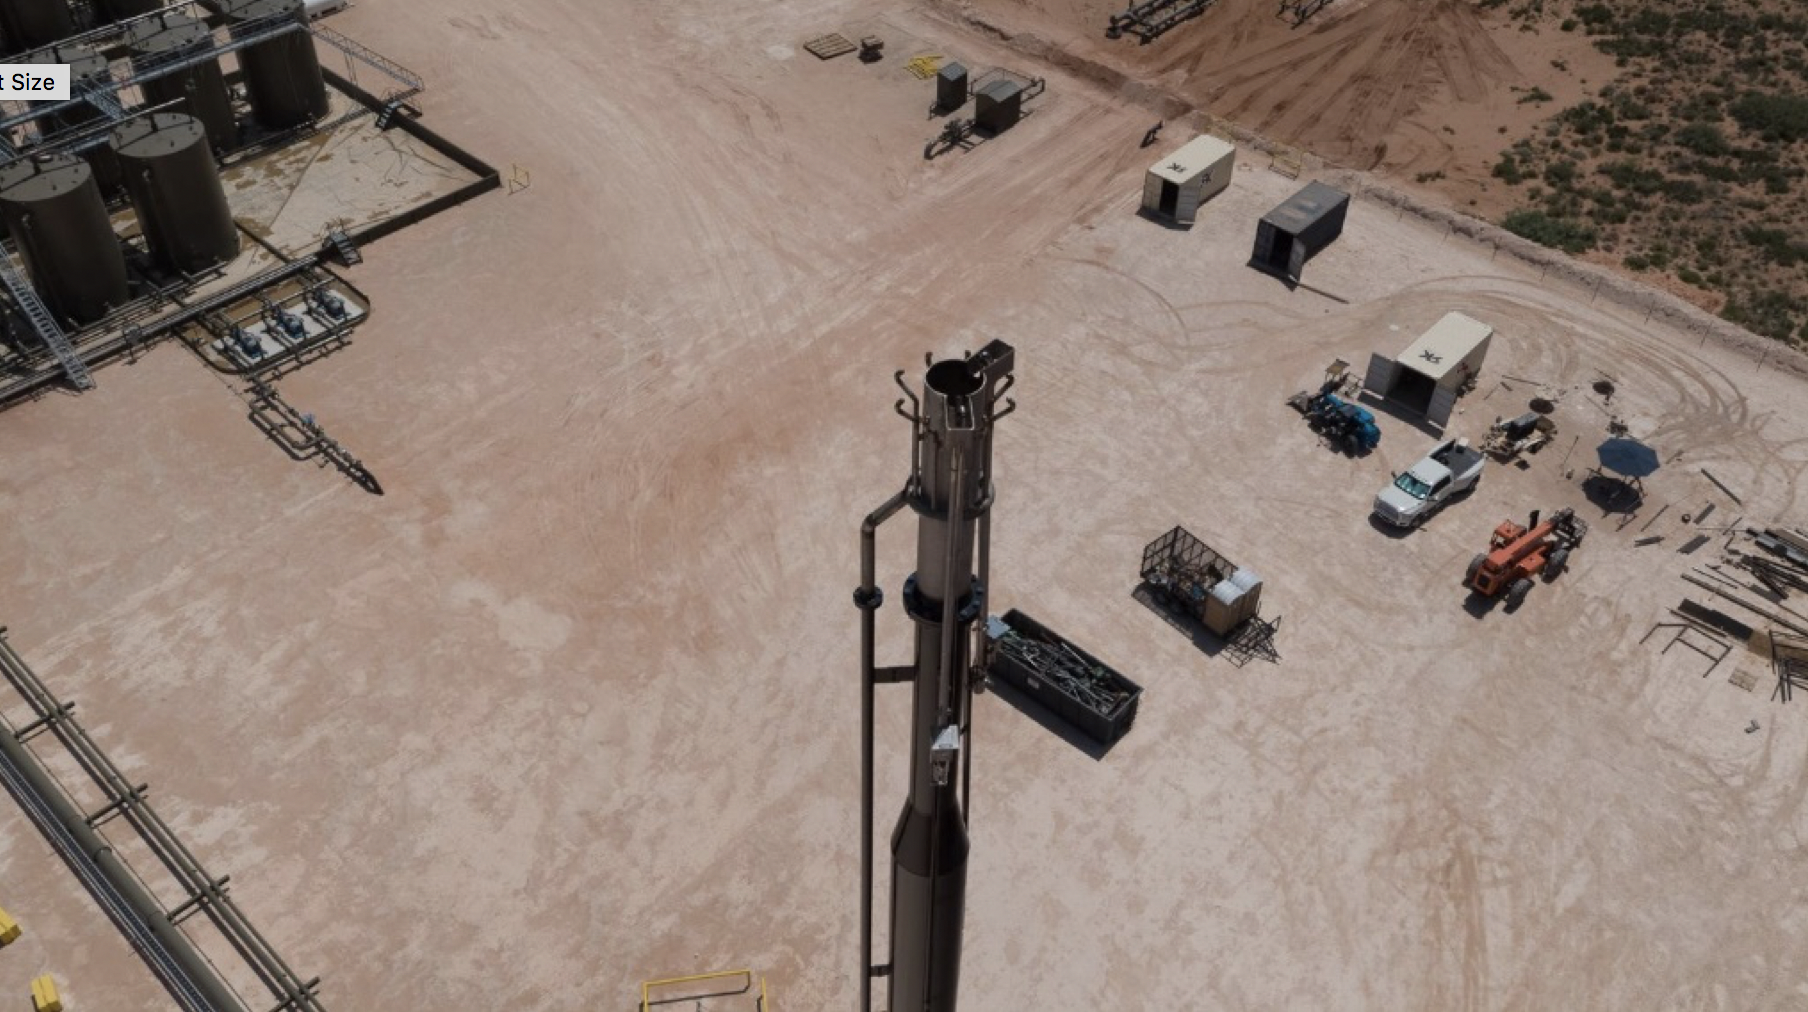
Aircraft equipped with a methane sensor (with or without an additional carbon dioxide sensor) flown downwind of oil and gas processing sites can be used to identify if the study area includes a flare that is unlit or at low efficiency. Where a specific plume is identified modelling can be used to determine the source and magnitude. Under some circumstances this may identify a flare that is unlit or operating inefficiently within a populationof flares.
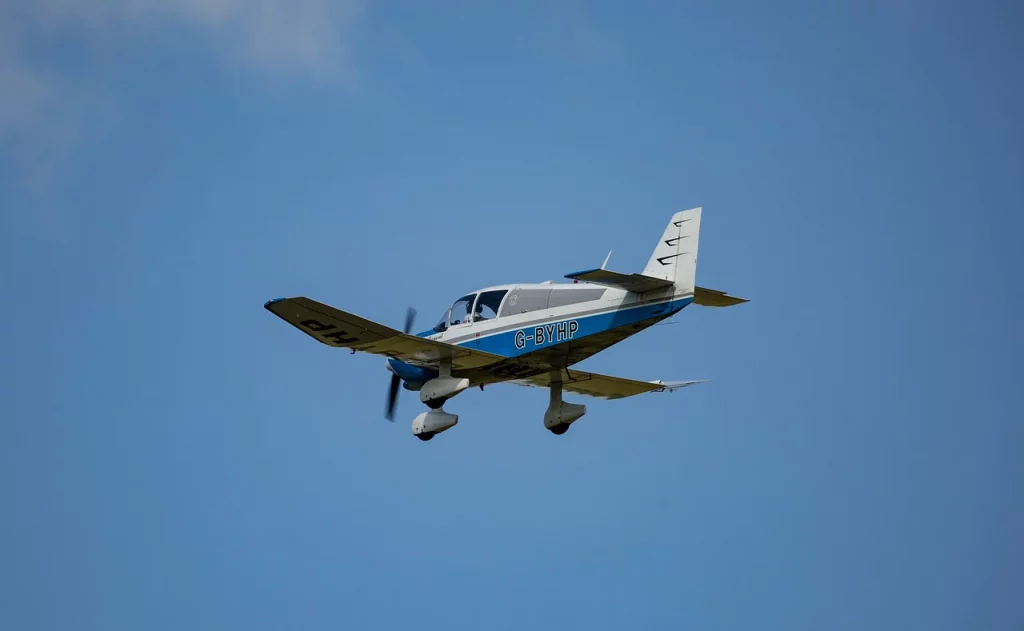
Methane sensors are now routinely available that can be mounted on fixed wing aircraft. The aircraft are flown downwind of oil and gas operating sites, adopting either a raster formation or perimeter flights. Total methane emitted from the study area is calculated as the difference between signal intensity upwind and downwind of the study area.
The mass flux F through surfaces that encompass the emission source. For each surface, the following equation is applied:
![]()
Where C is the concentration of methane, v is the wind speed, θ is the angle between the normal to the measured plane and the wind vector, and dA indicates the area integral.
It is not important to know how many emission sources there are, or where they are. As long as the measurements are taken well, there is little room for error.
More details can be found in Peischl et. Al. 2015.
Where a plume is encountered, the location and magnitude of the source can be determined through the use of inverse dispersion modelling. The most commonly adopted model is the Gaussian dispersion model. The gaussian model aims to model the downwind plume from each emission source, in a steady-state scenario. The gaussian model is chosen because the effect of wind turbulence on methane dispersion is represented by 2D – Gaussian diffusion (in the y- and z- axis, if the plume is carried downwind along the x-axis). The equation used to model the plume concentration C at a distance y from the source, at a height zr from the ground, is the following:
![]()
Where Q is the emission rate, u is the wind speed, σy and σz are the horizontal and vertical dispersion coefficients, respectively, and He is the height above the ground of the plume centerline. For more details, see Yacovitch et. al. 2020.
Advantages
Sensitivity - Aircraft mounted methane sensorsSensors are devices that measure physical properties such as methane concentration, temperature, or radiance. For measuring flare efficiency the sensor must be capable of measuring methane and in some cases... Learn more... are amongst the most sensitive of field-deployed instruments with detection thresholds. As such, flaring induced methane anomalies can be distinguished large distances from the source.
Distance – Aircraft can cover large areas within a single survey, including flights that require long transit times (eg offshore)
Integrated surveys: Can be used as part of a regional emissions survey – including analysis of all sources of methane
Operates effectively over water
Limitations
Not specific to flaring – the sensor will identify all sources of emissions within the field including venting and fugitive
Requires an expert user to operate the equipment and back-calculate emissions. The majority of applications come from academic surveys, not routine and periodic inspections.
Specialist pilots and adapted aircraft are needed to perform the measurements, which may entail flying in close proximity to oil and gas facilities or other aviation constraints
Unless methane and CO2 are measured simultaneously, the efficiency of the flare can only be inferred by reference to production data.
Zavala et al. Combined aerial methane measurements using a modified single engine propeller aircraft equipped with a Picarro 2301f cavity ring-down spectrometer . Data was combined with regional satellite imagery (TROPOMI) and thermal satellite imagery (VIIRS) to provide independent estimates of methane emissions and flaring volumes.
The name of the paper reflects the differences seen in emissions for onshore and offshore production.
For the onshore study region and for the facility-level estimates, the aircraft is flown in concentric horizontal loops at different altitudes . The flights start at an altitude of roughly 150 m and keep ascending until the aircraft is above the plume as indicated by the
measurement instrument in real-time. Up to 30-laps of the facility are completed. Gauss’s Theorem is used to estimate the horizontal flux for each loop and a total emission rate by incorporating a mass trend.
Results from an onshore gas gathering station supporting offshore production. Data from one facility are >80 times higher than the reported emissions.
For a second facility two sets of flights combined CH4 and CO2 measurements were combined with estimates of gas composition to derive indicative efficiency values. These data suggest a flaring combustion efficiency of ∼94%