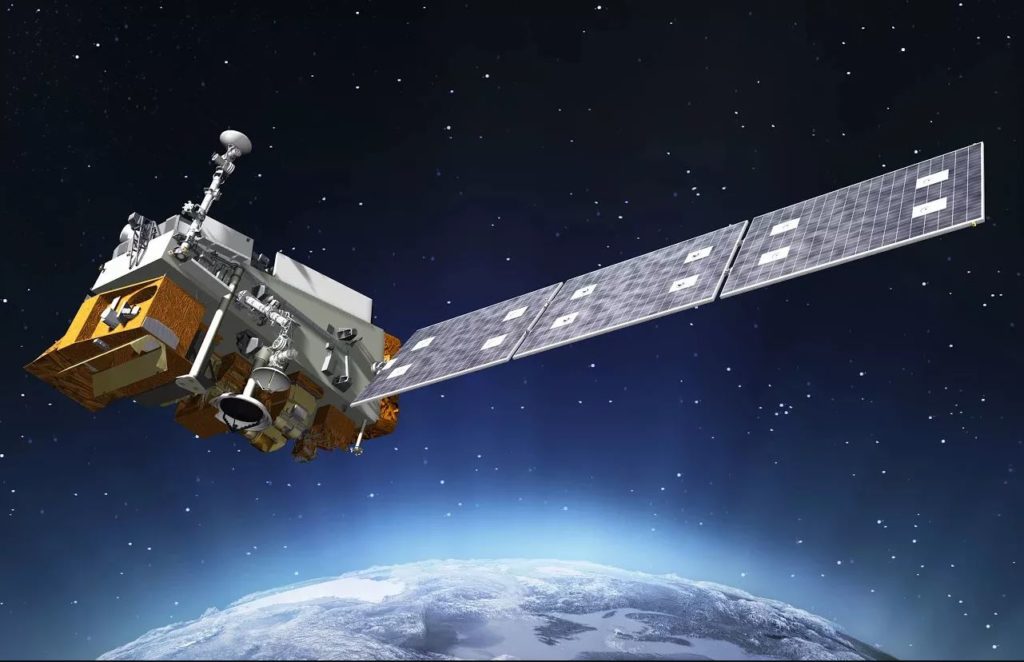
Heat emitted by flares can be monitored by satellites equipped with infra-red sensorsSensors are devices that measure physical properties such as methane concentration, temperature, or radiance. For measuring flare efficiency the sensor must be capable of measuring methane and in some cases… Learn more… such as the Visible InfraredA wavelength just greater than that of the red end of the visible light spectrum but less than that of microwaves. Infrared radiationhas a wavelength from about 800nm to 1… Learn more… Imaging Radiometer Suite (VIIRS). The temperature and spectral range of the flare can be used to differentiate flaring from other hot signatures.
Measurements are conducted at night. Regular monitoring of heat data has been successfully used to estimate both volumes of total flaring and changes with time. It is not a direct measurement of methane emissions and cannot see cold sources – such as an unlit flare.
Where VIIRS data can be combined with operational data such as changes in flow rate and composition it is possible to infer gross changes in flare efficiency. Without operational data, a change in efficiency is more challenging to be differentiated from a change in flare volumes.
Environmental effects, such as cloud cover and wind can impact data quality.
Main image courtesy of National Oceanic & Atmospheric Administration (NOAA)
The Visible Infrared Imaging Radiometer Suite (VIIRS) instrument is aboard the joint NASA/NOAA Suomi National Polar-orbiting Partnership (Suomi NPP) and NOAA-20 satellites. It is a 22-band (spectral channels) imaging radiometer that collects visible and infrared imagery and is unique for collecting near and short wave infrared data at night.
VIIRS provides global coverage daily with 375~750 m resolution (depending on band) making it possible to isolate many individual flares within the field of view. During the night-time, VIIRS continues to record data in near and short-wave infrared channels designed for daytime imaging. With sunlight eliminated, the hot pixels identified in these channels indicate combustion sources.
Advantages
High resolution -capable of picking up small flares
VIIRS Day/Night Band also provides night-time imagery which can be used to quality control detections
Data products are publicly available and are being continuously evolved/improved
Vendors provide a range of data analysis and interpretation tools – including alerts for operated and non-operated facilities
Limitations
Uncertainties become larger when analysing multiple sub-pixel flares as well as intermittent flares (on/off multiple times through the day)
Four-hour temporal latency
Accuracies are impacted when cloud cover percentages are high
Does not directly measure methane emissions – and is therefore blind to cold sources such as an unlit flare (which conversely has the highest greenhouse gas impact as none of the gas is being combusted.)
Case study
The following article is reproduced courtesy of FlareIntel
An independent operator in Algeria’s flare gas system upgrade
Our chosen case from Algeria is particularly interesting as we can not only independently confirm that the operator reduced emissions of CO2 from flaring, but also reduced emissions from methane from incomplete combustion. Given that methane is a particularly potent greenhouse gas (by a factor of 84 times on a mass basis, or 31 on a volume basis over a twenty year period), the operator’s actions are particularly significant.
This particular flare has been consistently high since 2012. Our FlareIntel Pro tool notified us (with an automatic email alert) of a significant drop in flaring (from around 18 million scf/d, to 9 million scf/day), simultaneously associated with a higher flare temperature. We immediately engaged the operator, although they were somewhat surprised and perplexed by our sudden interest. Yet, a deeper discussion with the operatives led to a rich conversation and a keen interest to work with us to validate our findings.
Our subsequent discussions revealed that the operator had recently completed an emissions reduction project that included replacing 200 valves and changing the flare tip. Changing out the valves resulted in less leakage, more product recovery and significantly lower volumes of gas reaching the flare system. Changing the flare tip improved the combustion efficiency of flare, meaning that the so-called “methane slip” (i.e. release of unburnt gas, in the form of methane, CH4) was reduced, resulting in a more efficient and higher-temperature burn.
According to our FlareIntel Pro calculation, these interventions led to a 9 million scf/d reduction in flare volumes and a 10% improvement in combustion efficiency. The operator increased annual revenues by $7 million and save 2 million CO2-equivalent tonnes per year.
We congratulate the operator for its proactivity and their management in exhibiting leadership – and were delighted that our independently verified data was used to demonstrate to the regulator and the National Oil Company the company’s support to delivering Algeria’s commitments to end routine gas flaring by 2030. Given that Sonatrach is a signatory to the World Bank’s “Zero Routine Flaring” by 2030 initiative, these contributions are particularly important and inspirational.

Profiles of the temperature (top-left chart) and volume (lower-right chart) at an oilfield in Algeria. Capterio’s FlareIntel Pro tool identified a significant drop in flaring associated with a significant increase in flare temperature. Discussions with the operator revealed that their operational adjustments had not only reduced emissions by 74%, but also increased revenues by $7 million per year